
In this, yet another, practical post, I will guide you through the simple setup, which will allow you to track the number of pulls of the Docker images uploaded to the Docker hub. By reading the post, you will learn about Metricbeat’s HTTP module, Ingest pipeline, and use Kibana to explore a few simple visualizations. I hope you will find some inspiration for your tasks, which you are at right now.
Docker Image pull statistics
When I published my first Docker image to the Docker hub , I was interested if I could see any statistics around the image. It was fueled by my curiosity and also hunger for more data to play with. I quickly found out that one can simply use the API to pull data from the Docker hub related to any public image.This is the API you need to request: https://hub.docker.com/v2/repositories/<account>/<image-name>.
The value of <account> is your user/company account at Docker hub, and the <image> is self-explanatory. While it is easy with your developed images as the <account> is typically your username or the company’s registered name, there is a hidden logic for Docker images, which are the
official images hosted on the Docker hub. As an example, if you want to access stats for
Apache httpd Docker image, then the API’s URI /v2/repositories/<account>/<image-name> is different. The <account> variable must have the value library, so in this case, you need to access URI: /v2/repositories/library/httpd.
To have a bit more variety, I will use two public Docker images ( Apache httpd , MySQL ), and a couple of my own. With well-known software’s images, you will see more data, dynamic changes, and prettier visualizations over time.
Once you query the API, the response you will see will be similar to the examples below for Netatmobeat and Apache httpd Docker images.
Netatmobeat
GET https://hub.docker.com/v2/repositories/radoondas/netatmobeat
{
    "user": "radoondas",
    "name": "netatmobeat",
    "namespace": "radoondas",
    "repository_type": "image",
    "status": 1,
    "description": "https://github.com/radoondas/netatmobeat",
    "is_private": false,
    "is_automated": false,
    "can_edit": false,
    "star_count": 0,
    "pull_count": 159,
    "last_updated": "2020-04-30T14:19:23.613112Z",
    "is_migrated": false,
    "collaborator_count": 0,
    "affiliation": null,
    "has_starred": false,
    "full_description": "Netatmobeat\nhttps://github.com/radoondas/netatmobeat",
    "permissions": {
        "read": true,
        "write": false,
        "admin": false
    }
}
Apache httpd
Stats fot Apache httpd Docker image
GET https://hub.docker.com/v2/repositories/library/httpd
GET https://hub.docker.com/v2/repositories/library/httpd{
"user": "library",
"name": "httpd",
"namespace": "library",
"repository_type": "image",
"status": 1,
"description": "The Apache HTTP Server Project",
"is_private": false,
"is_automated": false,
"can_edit": false,
"star_count": 3318,
"pull_count": 2242267726,
"last_updated": "2021-01-12T13:42:29.184204Z",
"is_migrated": false,
"collaborator_count": 0,
"affiliation": null,
"has_starred": false,
"full_description": "# Quick reference\n\n-\t**Maintained by**: \n\t[the Docker Community].....",
"permissions": {
"read": true,
"write": false,
"admin": false
}
}
The indexing pipeline/strategy
Now, when we know and understand how the source API works, we can think of how to ‘save’ actual documents periodically and visualize them to our advantage. We will use only Elastic Stack components to minimize the tooling and keep all under the same hood.Our pipeline consists of Metricbeat, Elasticsearch, and Kibana.
Metricbeat (http module) -> Elasticsearch (data store) <-> Kibana (visualization)
- Metricbeat - The purpose of Metricbeat is to configure and use the http module. The module is easy to configure and maintain, and on top of it allows us to repeat the query to the API periodically. The footprint of Metricbeat on the system is small, and there are several other advantages. One of them is the compatibility with the entire Elastic Stack ecosystem. You do not need to maintain a custom script to be compatible with Elasticsearch in the future.
- Elasticsearch - The data store for us and much more. As the source document contains more fields than we want, we can get rid of them by using the Ingest pipeline when indexing the document.
- Kibana - The visible part of the solution, where we will use a few visualizations to show the data we saved.
Our original document from the source of the API, consists of many fields. After indexing the source document, we want to keep only a few fields to save space and have a better performance if we index a lot of data. The final document will look like the following, where we keep only a few key metrics together with the name and namespace of the Docker image.
Netatmobeat
{
      "doc": {
        "_index": "index",
        "_type": "_doc",
        "_id": "id",
        "_source": {
          "@timestamp": "2021-01-15T10:07:45.755Z",
          "http": {
            "docker_hub": {
              "namespace": "radoondas",
              "name": "netatmobeat",
              "collaborator_count": 0,
              "star_count": 0,
              "pull_count": 159
            }
          },
          "@metadata": {}
        },
        "_ingest": {
          "timestamp": "2021-01-15T15:44:31.014546112Z"
        }
      }
    }
Apache httpd
Apache httpd document
{
      "doc": {
        "_index": "index",
        "_type": "_doc",
        "_id": "id",
        "_source": {
          "@timestamp": "2021-01-15T10:07:40.660Z",
          "http": {
            "docker_hub": {
              "namespace": "library",
              "name": "httpd",
              "collaborator_count": 0,
              "pull_count": 2244658322,
              "star_count": 3321
            }
          },
          "@metadata": {}
        },
        "_ingest": {
          "timestamp": "2021-01-15T15:44:31.014531308Z"
        }
      }
    }
(Elastic) Ingest pipeline
To get the document with only a few properties as described earlier, we will configure Elasticsearch Ingest pipeline to parse the document before it is saved into the index. I prepared this pipeline, and you can find the source code in my GitHub Example repository. The pipeline itself is short and only consists of 2 instances of the Remove processor .
The functionality of the pipeline is pretty simple. From the original document, we will remove 6 + 12 fields.
Ingest pipeline definition
{
  "processors": [
    {
      "remove": {
        "field": [
          "ecs",
          "metricset",
          "agent",
          "host",
          "event",
          "service"
        ],
        "description": "Removes unnecessary general fields."
      }
    },
    {
      "remove": {
        "field": [
          "http.docker_hub.permissions",
          "http.docker_hub.last_updated",
          "http.docker_hub.user",
          "http.docker_hub.is_private",
          "http.docker_hub.is_automated",
          "http.docker_hub.is_migrated",
          "http.docker_hub.can_edit",
          "http.docker_hub.description",
          "http.docker_hub.repository_type",
          "http.docker_hub.status",
          "http.docker_hub.full_description",
          "http.docker_hub.has_starred"
        ],
        "ignore_failure": true,
        "description": "Removes unnecessary docker hub event fields."
      }
    }
  ]
}
While developing your own Ingest Pipeline, you can use the
Kibana pipeline UI .

Edit Pipeline
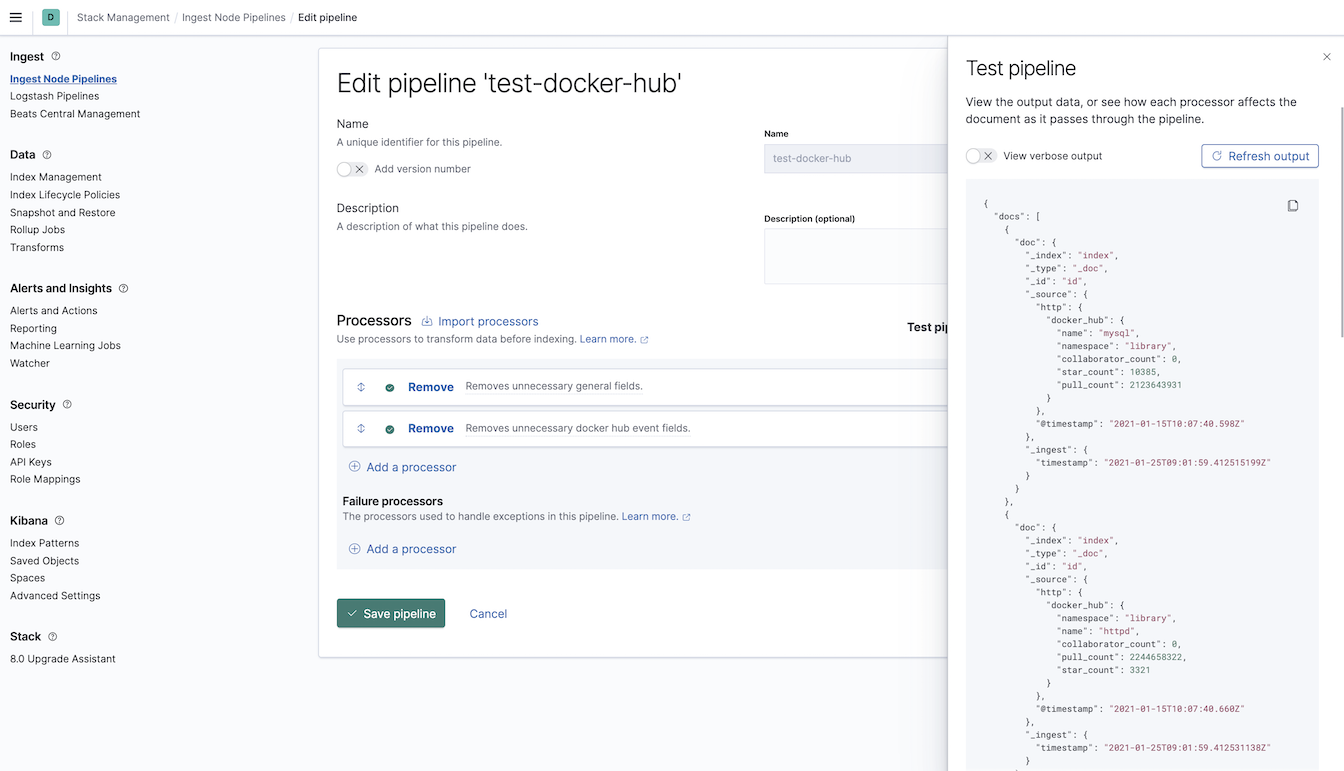
Test Pipeline
Another option is to use the pipeline endpoint with the
simulate pipeline API . You can find my
testing pipeline with multiple documents in the GitHub repository.
Simulate Ingest pipeline
POST /_ingest/pipeline/_simulate
POST /_ingest/pipeline/_simulate
{
 "pipeline" :
 {
 "processors": [
   {
     "remove": {
       "field": [
         "ecs",
         "metricset",
         "agent",
         "host",
         "event",
         "service",
         "@metadata"
       ],
       "description": "Removes unnecessary general fields."
     }
   },
   {
     "remove": {
       "field": [
         "http.docker_hub.permissions",
         "http.docker_hub.last_updated",
         "http.docker_hub.user",
         "http.docker_hub.is_private",
         "http.docker_hub.is_automated",
         "http.docker_hub.is_migrated",
         "http.docker_hub.can_edit",
         "http.docker_hub.description",
         "http.docker_hub.repository_type",
         "http.docker_hub.status",
         "http.docker_hub.full_description",
         "http.docker_hub.has_starred"
       ],
       "ignore_failure": true,
       "description": "Removes unnecessary docker hub event fields."
     }
   }
 ]
},
 "docs": [
   {
   "_index":"index",
   "_id":"id",
   "_source" : {
     "@timestamp": "2021-01-15T10:07:40.660Z",
     "@metadata": {
       "beat": "metricbeat",
       "type": "_doc",
       "version": "7.10.1"
     },
     "metricset": {
       "name": "json",
       "period": 60000
     },
     "service": {
       "type": "http",
       "address": "https://hub.docker.com/v2/repositories/library/httpd"
     },
     "http": {
       "docker_hub": {
         "can_edit": false,
         "repository_type": "image",
         "description": "The Apache HTTP Server Project",
         "pull_count": 2.244658322e+09,
         "has_starred": false,
         "collaborator_count": 0,
         "namespace": "library",
         "is_private": false,
         "name": "httpd",
         "full_description": "# Quick reference\n\n-\t**Maintained by**:  ... software contained within.",
         "last_updated": "2021-01-12T13:42:29.184204Z",
         "status": 1,
         "is_migrated": false,
         "permissions": {
           "read": true,
           "write": false,
           "admin": false
         },
         "is_automated": false,
         "star_count": 3321,
         "user": "library"
       }
     },
     "agent": {
       "name": "e8de185fde59",
       "type": "metricbeat",
       "version": "7.10.1",
       "hostname": "e8de185fde59",
       "ephemeral_id": "a8187f55-fd07-4c78-a35d-0bed3fd07f5c",
       "id": "526252d2-8bee-4700-9c54-9b34dbe77666"
     },
     "ecs": {
       "version": "1.6.0"
     },
     "host": {
       "name": "e8de185fde59"
     },
     "event": {
       "duration": 909992043,
       "dataset": "http.docker_hub",
       "module": "http"
     }
   }},
   {
   "_index":"index",
   "_id":"id",
   "_source" : {
     "@timestamp": "2021-01-15T10:07:45.755Z",
     "@metadata": {
       "beat": "metricbeat",
       "type": "_doc",
       "version": "7.10.1"
     },
     "service": {
       "type": "http",
       "address": "https://hub.docker.com/v2/repositories/radoondas/netatmobeat"
     },
     "event": {
       "dataset": "http.docker_hub",
       "module": "http",
       "duration": 670773253
     },
     "metricset": {
       "name": "json",
       "period": 60000
     },
     "http": {
       "docker_hub": {
         "user": "radoondas",
         "has_starred": false,
         "namespace": "radoondas",
         "can_edit": false,
         "collaborator_count": 0,
         "full_description": "Netatmobeat\nhttps://github.com/radoondas/netatmobeat",
         "description": "https://github.com/radoondas/netatmobeat",
         "star_count": 0,
         "last_updated": "2020-04-30T14:19:23.613112Z",
         "repository_type": "image",
         "is_migrated": false,
         "pull_count": 159,
         "name": "netatmobeat",
         "is_private": false,
         "is_automated": false,
         "status": 1,
         "permissions": {
           "write": false,
           "admin": false,
           "read": true
         }
       }
     },
     "ecs": {
       "version": "1.6.0"
     },
     "host": {
       "name": "e8de185fde59"
     },
     "agent": {
       "hostname": "e8de185fde59",
       "ephemeral_id": "a8187f55-fd07-4c78-a35d-0bed3fd07f5c",
       "id": "526252d2-8bee-4700-9c54-9b34dbe77666",
       "name": "e8de185fde59",
       "type": "metricbeat",
       "version": "7.10.1"
     }
   }
 }
]
}
Metricbeat's HTTP module
The last (technically the first) part of the puzzle is the configuration of thehttp module for Metricbeat. We will configure the module to query the Docker hub API periodically to request the latest statistics. The structure consists of the module definition where we define the URL’s of the API and the output (destination) for the documents.
Also, notice the ingest pipeline configuration for the documents pipeline: docker-hub-pulls, which we explained above.
Complete configuration (
metricbeat.docker.yml ) file is in GitHub repository. Example section of http module and the output configuration.
- module: http
  enabled: true
  metricsets:
    - json
  period: 5m
  hosts:
    - "https://hub.docker.com/v2/repositories/library/httpd"
    - "https://hub.docker.com/v2/repositories/library/mysql"
  namespace: "docker_hub"
  path: "/"
  method: "GET"

output.elasticsearch:
  hosts: 'localhost:9200'
  index: docker-pulls-%{+yyyy}
  pipeline: docker-hub-pulls
We did not mention the template definition for our documents. Metricbeat comes with the template and we will simply use that one but extend with addional (form the API) fields. We define this in the same metricbeat.docker.yml configuration file. There are only 5 fields to configure as you can see in the configuration setup.template.append_fields.
setup.template.overwrite: true
setup.template.append_fields:
  - name: http.docker_hub.namespace
    type: keyword
  - name: http.docker_hub.name
    type: keyword
  - name: http.docker_hub.collaborator_count
    type: long
  - name: http.docker_hub.pull_count
    type: long
  - name: http.docker_hub.star_count
    type: long
Howto
It is time to put all the information we have together into a few simple steps to achieve the goal.1. Checkout example GitHub repository
$ git clone https://github.com/radoondas/examples.git
$ cd examples/radoondas.io/docker-image-stats
2. Start your Elasticsearch cluster
It is up to you to make sure you have the cluster up and running. The demo expects that you have port 9200 for Elasticsearch and port 5601 for Kibana. You can also run the bundled docker-compose configuration to spin up one node cluster if you want to.
Optional
$ docker-compose up -d
Make sure that the cluster is up and running and Kibana is accessible.
3. Import the Ingest pipeline
Before we start up the Metricbeat to pull the Docker hub API documents, we want to ensure that the document processing pipeline is up and running. There are at least two options available. You can use the Kibana Dev Tools to execute the following pipeline PUT request.
Ingest pipeline definition
PUT /_ingest/pipeline/docker-hub-pulls
PUT /_ingest/pipeline/docker-hub-pulls{
"processors": [
{
"remove": {
"field": [
"ecs",
"metricset",
"agent",
"host",
"event",
"service"
],
"description": "Removes unnecessary general fields."
}
},
{
"remove": {
"field": [
"http.docker_hub.permissions",
"http.docker_hub.last_updated",
"http.docker_hub.user",
"http.docker_hub.is_private",
"http.docker_hub.is_automated",
"http.docker_hub.is_migrated",
"http.docker_hub.can_edit",
"http.docker_hub.description",
"http.docker_hub.repository_type",
"http.docker_hub.status",
"http.docker_hub.full_description",
"http.docker_hub.has_starred"
],
"ignore_failure": true,
"description": "Removes unnecessary docker hub event fields."
}
}
]
}
Or execute single curl request to do the same from CLI.
# Import Ingest pipeline
curl -s -H "Content-Type: application/x-ndjson" -XPUT "localhost:9200/_ingest/pipeline/docker-hub-pulls" \
  --data-binary "@conf/ingest_pipeline_docker_hub.json"; echo
# You should see response message:
{"acknowledged":true}
To verify that the pipeline is uploaded, use the
Console in Kibana Dev tools and execute GET _ingest/pipeline/docker-hub-pulls. The output is the complete definition of the pipeline.
4. Start up the Metricbeat
It is time to start the Metricbeat, pull Documents from the API and send them to the Output - Elasticsearch. Note, that if you do not have the Docker image of Metricbeat, it will be downloaded.
$ docker run -d \
  --name=metricbeat \
  --user=root \
  --network=host \
  --volume="$(pwd)/metricbeat.docker.yml:/usr/share/metricbeat/metricbeat.yml:ro" \
  --volume="$(pwd)/modules/system.yml:/usr/share/metricbeat/modules.d/system.yml:ro" \
  docker.elastic.co/beats/metricbeat:7.10.2 metricbeat -e
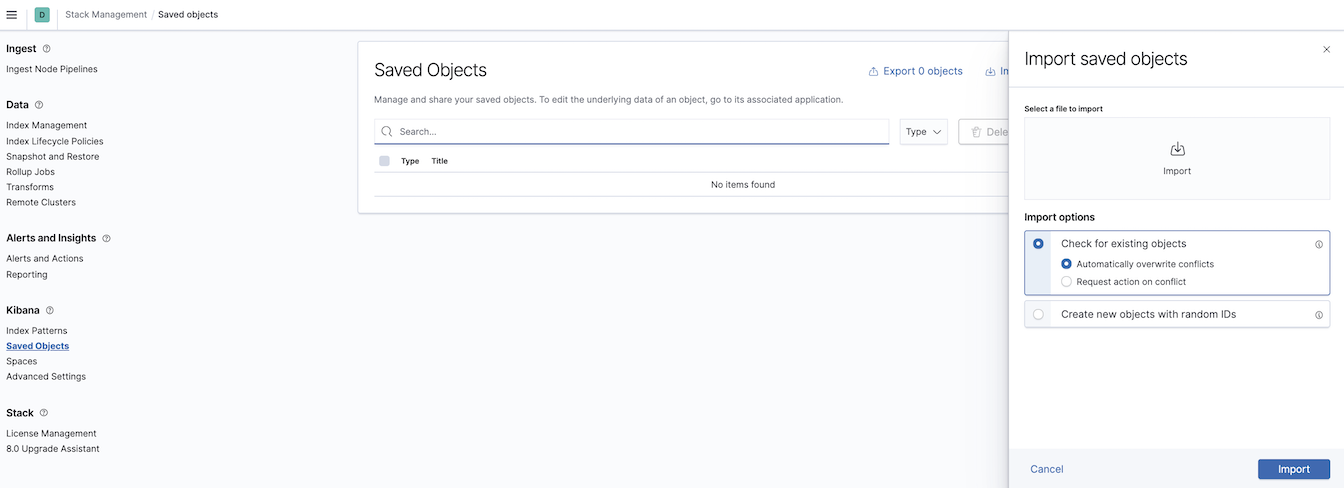
5. Import Kibana visualisations and objects
Using Kibana UI, import saved objects stored in the Example repository.
In Kibana navigate to
Saved Objects page in Stack Management menu. Use the Import button to load the source file’s content (radoondas.io/docker-image-stats/conf/saved_objects.ndjson).
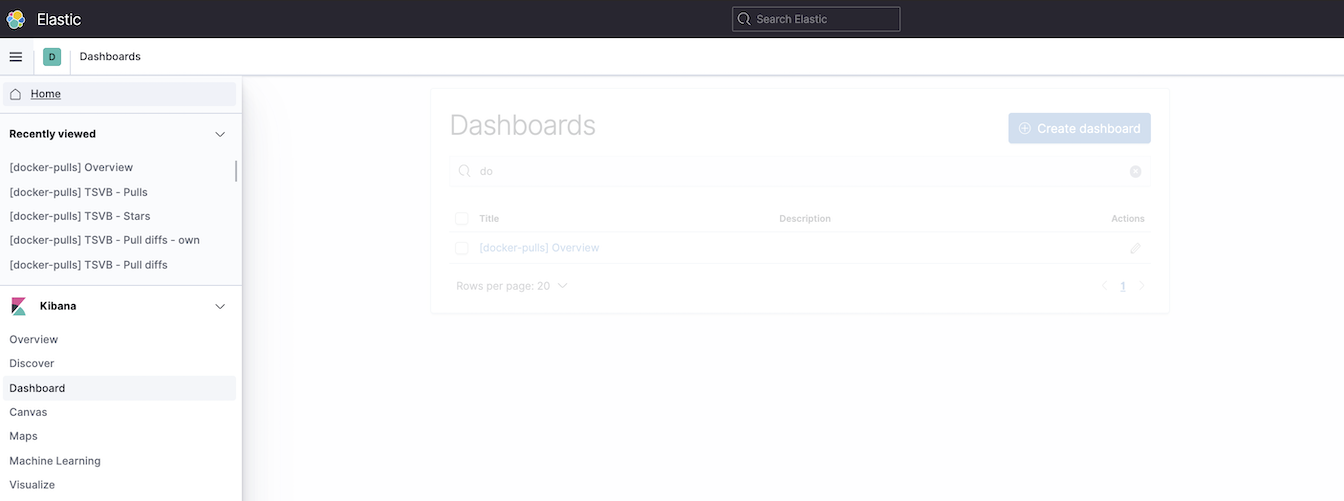
6. Explore the Dashboard
Now it is time to explore the data.
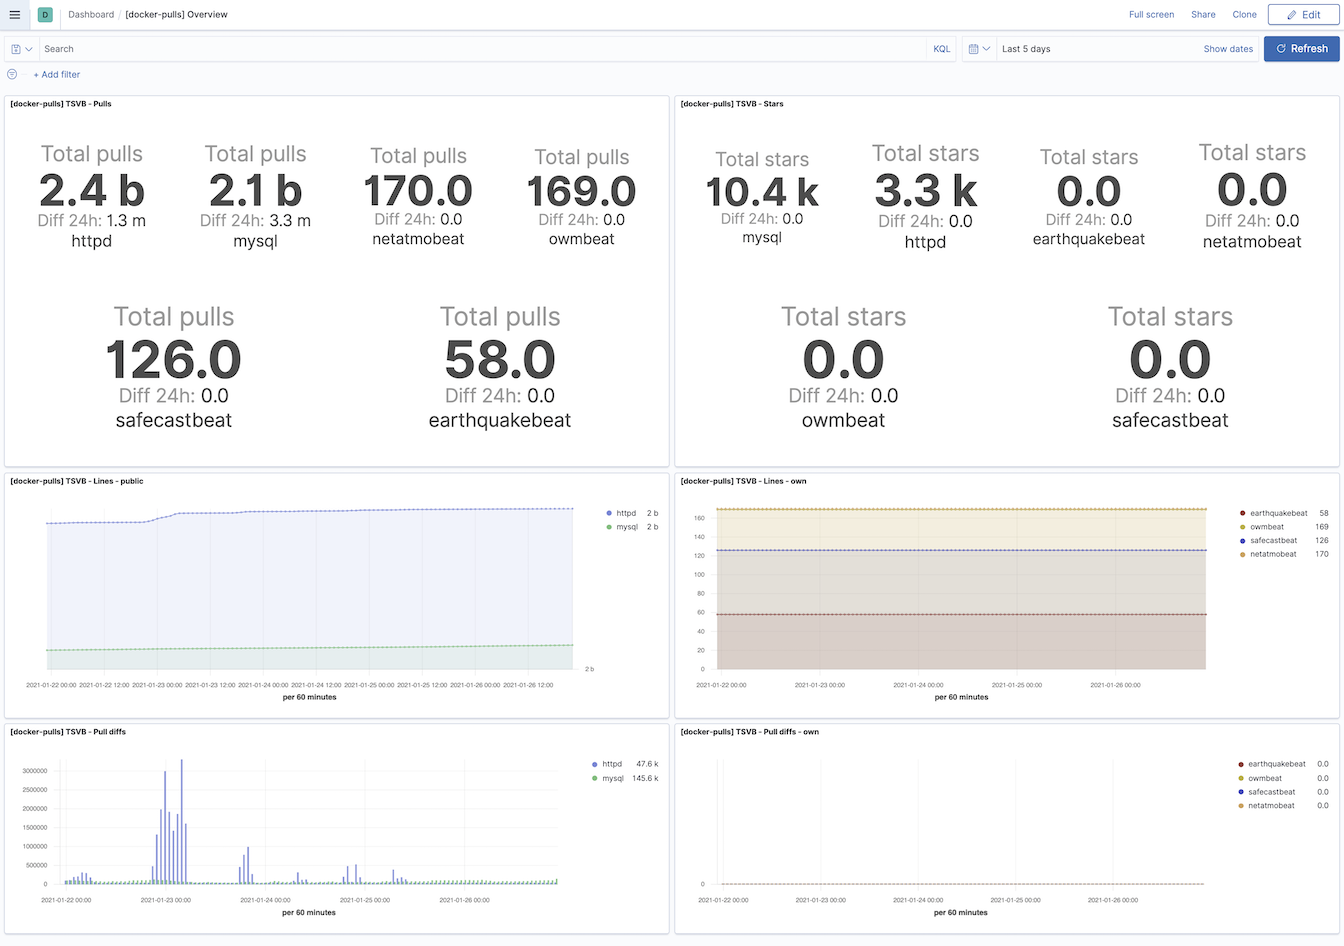
Navigate to the Dashboards in Kibana and open [docker-pulls] Overview
Look around and change the time frame of the dashboard to narrow down the data set. It will take time to populate your data set, but eventually, the visualizations will look similar to what you see in the picture below.

Change values in the Date-Time picker to widen the time range.

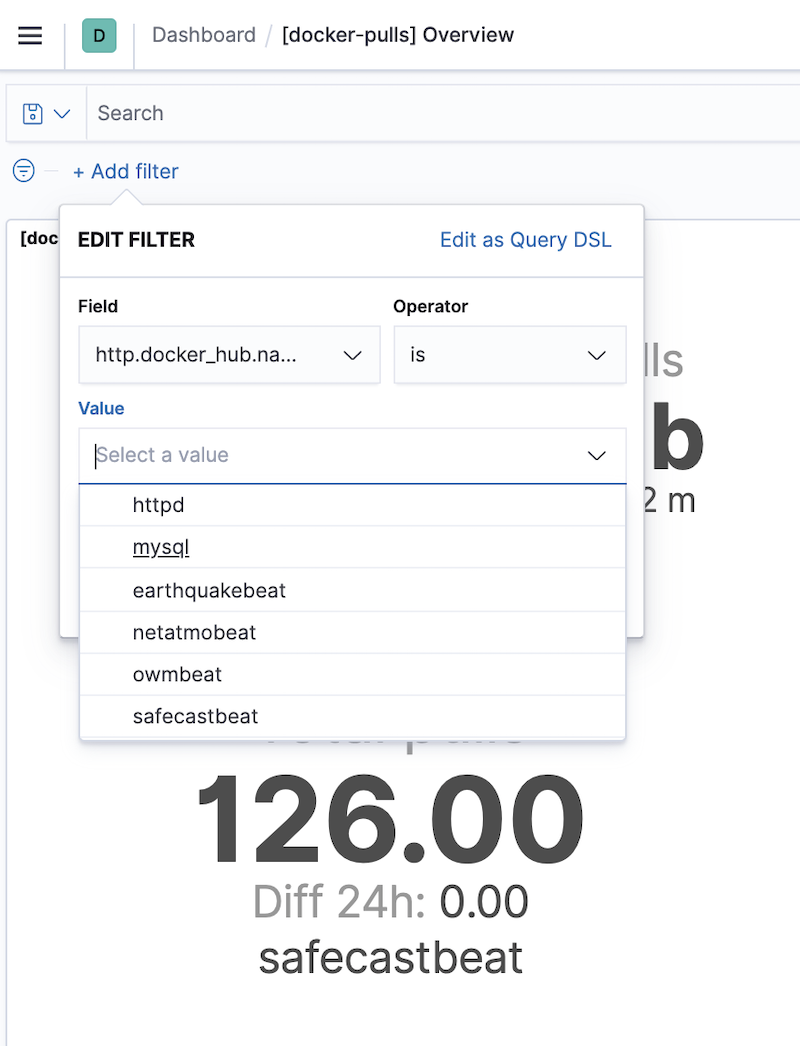
Or use Filters to choose specific data you are interested in.
I hope that you found Today a few practical information and tips, or you had fun running this simple hands-on experience with Elastic Stack. If you have any comments or thought, let me know in the comments.