
Welcome to another blog post where we explore another exciting dataset with Elastic Stack. Today, you will learn how to ingest and analyze Historical Tornadoes tracks covering 69 years’ worth of data. We will explore the dataset, create the ingest pipeline, consume the CSV file with Filebeat, store tornadoes in Elasticsearch, and visualize them in Kibana.
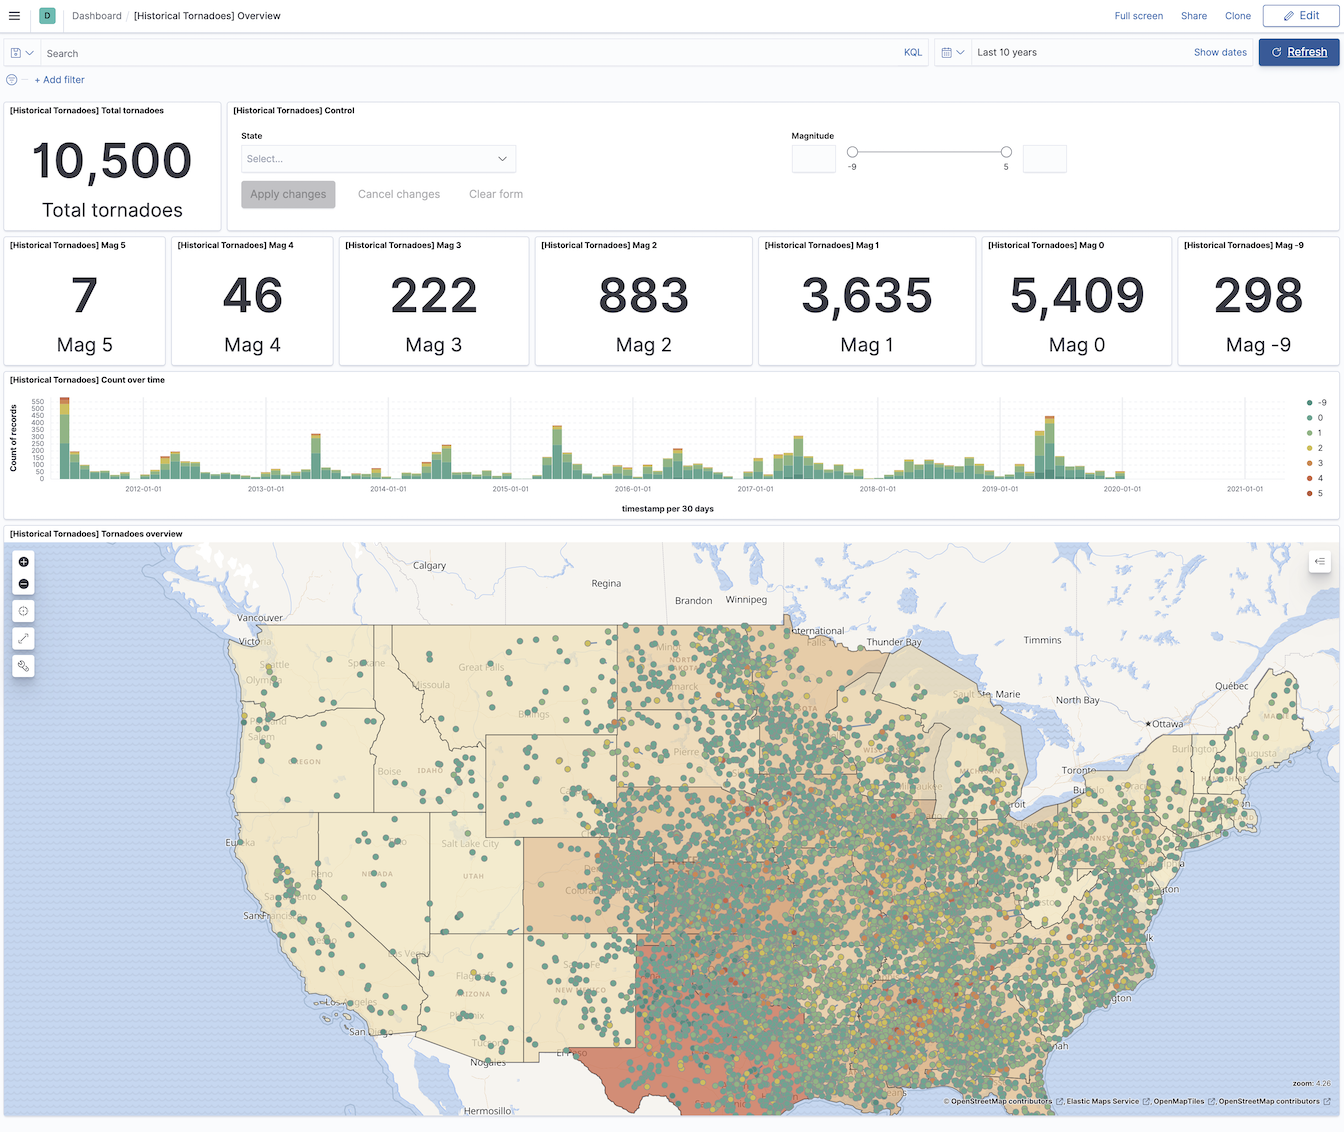
Historical tornadoes for past 10 years
The Dataset
The primary data source for the historical tracks of tornadoes comes from NOAA’s National weather service storm prediction center. You can read about details on the dataset in its document where you can also learn more about each column. This dataset (as of writing the blog post) covers tornadoes from the years 1950 to 2019.Download the data directly using the
link , or visit the NOAA’s
page and download the file 1950-2019_actual_tornadoes.csv (7.0 MB) from the source if the direct link above does not work. I have also included the copy of the data in my Github repository in the data folder -
1950-2019_actual_tornadoes.csv .
Note, the file name of the CSV file will change over time as new data are added each year.
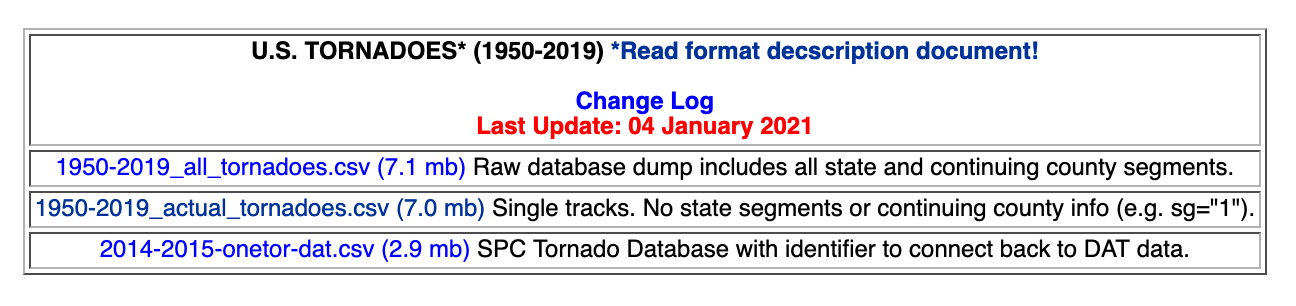
The original data's web page
Tornado document example
The data source consists of the file in the CSV format where each line represents one tornado event, and its different properties are separated by , character.
The very first line of the CSV is the names of tornadoes properties (columns), and the explanation of each column is described in the original document .
"om","yr","mo","dy","date","time","tz","st","stf","stn",
"mag","inj","fat","loss","closs","slat","slon","elat","elon",
"len","wid","ns","sn","sg","f1","f2","f3","f4","fc"
A random tornado event from the CSV file might look like the following.
617024,2018,12,31,2018-12-31,14:38:00,3,IN,18,0,1,0,0,20000,
0,38.0935,-86.0869,38.1000,-86.0470,2.2000,140,1,1,1,61,0,0,0,0
Unfortunately, the CSV format is not ready for Elasticsearch, and we need to transform these lines into a JSON document. We also need to make a few transformations to create the tornado event with the timestamp and Geographic Points representing the start and end of the tornado track. Some of the documents only have the starting position of the Tornado. To process lines in to correct JSON document, we will use ingest pipeline , and the final event will look similar to the one below.
Tornado event after Ingest pipeline transformation from the CSV format
{
  "docs": [
    {
      "doc": {
        "_index": "index",
        "_type": "_doc",
        "_id": "id",
        "_source": {
          "ns": "1",
          "tz": "3",
          "f1": "61",
          "f2": "0",
          "f3": "0",
          "f4": "0",
          "tpath": {
            "coordinates": [
              [
                -86.0869,
                38.0935
              ],
              [
                -86.047,
                38.1
              ]
            ],
            "type": "linestring"
          },
          "loss": "20000",
          "mag": "1",
          "wid": "140",
          "len": "2.2000",
          "sg": "1",
          "elocation": "38.1000,-86.0470",
          "fat": "0",
          "sn": "1",
          "om": "617024",
          "timestamp": "2018-12-31 14:38:00",
          "st": "IN",
          "closs": "0",
          "stf": "18",
          "inj": "0",
          "slocation": "38.0935,-86.0869",
          "stn": "0",
          "fc": "0"
        },
        "_ingest": {
          "timestamp": "2021-02-16T22:26:58.4035474Z"
        }
      }
    }
  ]
}
The indexing pipeline/strategy
There are several options for processing the CSV file and indexing the data (lines) into Elasticsearch. Each strategy has itspros and cons, and it only depends on your abilities, tools, and desired effect which option you choose. In this blog post, I decided to use a simple and straightforward path to achieve the goal.
Our pipeline
CSV file <- Filebeat (read the file) -> Elasticsearch (with Ingest pipeline) <-> Kibana (visualization)
- Filebeat - The purpose of Filebeat is to read the file line by line and send it to Elasticsearch for processing and indexing. The footprint of Filebeat on the system is small, and there are several other advantages. One of them is the compatibility with the entire Elastic Stack ecosystem. You do not need to maintain a custom script to be compatible with Elasticsearch in the future.
- Elasticsearch - The data store and much more. As the source document contains fields that we want to transform or remove, we do so by using the ingest pipeline when indexing the document.
- Kibana - The visible part of the solution, where we use a few visualizations to present tornadoes we indexed on the map and in the dashboard.
Let me also briefly mention other options - not discussed in this post - and note, there are more options than I list here.
- You can replace Filebeat with Logstash to do the same log forwarding. However, Logstash consumes more resources for the job as it requires Java.
- You can use Logstash not only for log forwarding but also to replace the ingest pipeline in Elasticsearch. To do that, you have to configure a series of filters to replicate Elasticsearch’s ingest pipeline behavior.
- In case you would have GEOJSON file format instead of the CSV, you could also use the GDAL library to upload documents to Elasticsearch. I wrote a short blog post about how to do that, and it is based on a great post published by Elastic.
(Elasticsearch) Ingest pipeline
To get our Tornado document transformed into JSON as described above, we will configure Elasticsearch ingest pipeline to parse the document before it is saved into the index. I did prepare the pipeline, and you can find the source code in the GitHub repository.The pipeline consists of several basic processors ( csv , set , convert , remove ) and also uses simple condition in the processors .
First, let’s have a look at one of the set processors.
{
"set": {
  "description": "If the value is not 0.0 in 'elat' or 'elon' fields. Creates the ending GeoPoint
  from 'elat' (latitude) and 'elon' (longitude) fields.",
  "if": "ctx.elon != '0.0' || ctx.elat != '0.0'",
  "field": "elocation",
  "value": "{{elat}},{{elon}}"
  }
}
"field": "elocation") with the value ("value": "{{elat}},{{elon}}). The curly brackets ({{ text }}) are placeholders for a content/value from another field in the document. The new field, after the execution, might have the value "elocation": "38.1000,-86.0470". There is also a condition to be checked in this processor ("if": "ctx.elon != '0.0' || ctx.elat != '0.0'") and the processor will be executed only if the value of the original field we want to use is not 0.0. This check prevents errors in the processor and also prevents incorrect values in case there would be 0.0 for the end location of the Tornado.
Processor convert with the if condition defined converts the first value (tpath.coordinates.0) of the array field to the float type. It is impossible to convert all values in an array in one step (or I did not invest enough time to figure it out). Note, another convert processor follows to ensure that both values in the Tornado field tpath have the type set correct.
{
  "convert": {
    "description": "Converts string representation of numbers to float.",
    "if": "ctx.elon != '0.0' || ctx.elat != '0.0'",
    "field": "tpath.coordinates.0",
    "type": "float"
  }
}
The remove processor removes all enlisted fields from the document. They are often useless, or we already applied their values and created a new field.
{
  "remove": {
    "field": [
      "date",
      "time",
      "yr",
      "mo",
      "dy",
      "slon",
      "slat",
      "elon",
      "elat",
      "message",
      "agent",
      "log"
    ]
  }
}
Full Ingest pipeline
{
  "description": "Pipeline for processing historical tornadoes tracks from CSV formatted data source. https://www.spc.noaa.gov/wcm/#data",
  "processors": [
    {
      "csv": {
        "description": "Initial parsing of the data line in CSV format.",
        "field": "message",
        "separator": ",",
        "target_fields": [
          "om",
          "yr",
          "mo",
          "dy",
          "date",
          "time",
          "tz",
          "st",
          "stf",
          "stn",
          "mag",
          "inj",
          "fat",
          "loss",
          "closs",
          "slat",
          "slon",
          "elat",
          "elon",
          "len",
          "wid",
          "ns",
          "sn",
          "sg",
          "f1",
          "f2",
          "f3",
          "f4",
          "fc"
        ]
      }
    },
    {
      "set": {
        "description": "Creates a timestamp from 'date' and 'time' fields.",
        "field": "timestamp",
        "value": "{{date}} {{time}}"
      }
    },
    {
      "set": {
        "description": "Creates the starting GeoPoint from 'slat' (latitude) and 'slon' (longitude) fields.",
        "field": "slocation",
        "value": "{{slat}},{{slon}}"
      }
    },
    {
      "set": {
        "description": "If the value is not 0.0 in 'elat' or 'elon' fields. Creates the ending GeoPoint from 'elat' (latitude) and 'elon' (longitude) fields.",
        "if": "ctx.elon != '0.0' || ctx.elat != '0.0'",
        "field": "elocation",
        "value": "{{elat}},{{elon}}"
      }
    },
    {
      "set": {
        "description": "If the value is not 0.0 in 'elat' or 'elon' fields. Creates 'tpath.type' field for the 'linestring' GeoShape.",
        "if": "ctx.elon != '0.0' || ctx.elat != '0.0'",
        "field": "tpath.type",
        "value": "linestring"
      }
    },
    {
      "set": {
        "description": "If the value is not 0.0 in 'elat' or 'elon' fields. Creates the coordinates field for linestring between geopoints ['slat','slon'] and ['elat',  'elon'] fields.",
        "if": "ctx.elon != '0.0' || ctx.elat != '0.0'",
        "field": "tpath.coordinates",
        "value": [
          [
            "{{slon}}",
            "{{slat}}"
          ],
          [
            "{{elon}}",
            "{{elat}}"
          ]
        ]
      }
    },
    {
      "convert": {
        "description": "Converts string representation of numbers to float.",
        "if": "ctx.elon != '0.0' || ctx.elat != '0.0'",
        "field": "tpath.coordinates.0",
        "type": "float"
      }
    },
    {
      "convert": {
        "description": "Converts string representation of numbers to float.",
        "if": "ctx.elon != '0.0' || ctx.elat != '0.0'",
        "field": "tpath.coordinates.1",
        "type": "float"
      }
    },
    {
      "remove": {
        "field": [
          "date",
          "time",
          "yr",
          "mo",
          "dy",
          "slon",
          "slat",
          "elon",
          "elat",
          "message",
          "agent",
          "log"
        ]
      }
    }
  ]
}
To develop the Ingest pipeline, we use the
_simulate API or Kibana
Ingest pipeline UI . The full example of the _simulate API call is in the
simulate-pipeline.txt document in the GitHub.
Index template
To accurately index each field in the Tornado document with dedicated correct data type, we have to configure an index template with mapping . We want to map numbers with explicit numeric type and the strings astext or keyword. We also have fields of type geo_point/geo_shape, and we want all of them to be mapped appropriately so we will be able to use them on the Map. Read more on different mapping types in Elastic
documentation .
In the following excerpt, you will find an example of each type used, and the full index template is in the GitHub repository file.
Partial index template
{
  "index_patterns": [
    "historical-tornadoes*"
  ],
  "settings": {
    "index": {
      "number_of_shards": 1,
      "number_of_replicas": 1,
      "final_pipeline": "historical-tornadoes"
    }
  },
  "mappings": {
    "properties": {
      "timestamp": {
        "type": "date",
        "format": "yyyy-MM-dd HH:mm:ss"
      },
      "closs": {
        "type": "float"
      },
      "fat": {
        "type": "short"
      },
      "len": {
        "type": "half_float"
      },
      "message": {
        "type": "text",
        "norms": false
      },
      "om": {
        "type": "integer"
      },
      "st": {
        "type": "keyword"
      },
      "slocation": {
        "type": "geo_point"
      },
      "tpath": {
        "type": "geo_shape"
      }
    }
  }
}
Filebeat configuration
In this use case, Filebeat reads the CSV file line by line and sends each one to Elasticsearch for processing and indexing. The configuration is fairly basic, as you can see in the example below, with important parts. Full Filebeat configuration is in the GitHub repository yaml file .- We have the
Inputwith the location of our CSV document with all tornadoes Outputconfiguration with thehost,indexname andpipelinename for data processing- We also disable ILM (Index lifecycle management) and set up a custom template for the index name in the section
setup.template.
All of the settings are documented in the Filebeat documentation for log input , Elasticsearch output , and index template setup.
filebeat.inputs:
  - type: log
    paths:
      - /tmp/1950-2019_actual_tornadoes.csv

output.elasticsearch:
  hosts: '127.0.0.1:9210'
  index: 'historical-tornadoes'
  pipeline: 'historical-tornadoes'

setup.ilm.enabled: false
setup:
    template:
      enabled: true
      type: legacy
      name: historical-tornadoes
      pattern: historical-tornadoes
      bulk_max_size: 2048
Howto
After the explanation of all the important bits and pieces, without further due, let’s bring ‘alive’ all the Tornadoes.1. Checkout Example GitHub repository
To get all the necessary parts for the demo, clone the Example repository.
$ git clone https://github.com/radoondas/examples.git
$ cd examples/radoondas.io/historical-tornado-tracks
2. The Data
We will use a copy of the data located in the repository. Note, in the future, when the data is updated with the latest events, you can download the dataset from also the original source .
Let’s verify that the data is in its location.
$ ls data/*.csv
data/1950-2019_actual_tornadoes.csv
3. Start your Elasticsearch cluster
It is up to you to make sure you have the Elasticsearch cluster up and running. Ensure that you configure port 9200 (default) for Elasticsearch and port 5601 (default) for Kibana. In case you do not have any cluster up and running, you can run the bundled docker-compose configuration to spin up one node cluster if you have the Docker daemon available.
Optional step
$ docker-compose up -d
Make sure that the cluster is up and running and Kibana is accessible. Open Kibana in the browser (http://127.0.0.1:5601) and check if the application is ready. If you see any errors or Kibana is not accessible, fix the cluster first before moving to the next step.
4. Upload the Ingest pipeline
Next, you upload the Ingest pipeline into Elasticsearch with the correct name to process our data from the Filebeat. When you have the pipeline ready, the actual upload is a simple curl PUT against the
_ingest/pipeline API endpoint.
# Ingest Pipeline
$ curl -XPUT 'http://127.0.0.1:9200/_ingest/pipeline/historical-tornadoes' \
  -H "Content-Type: application/json" -d @conf/pipeline_tornadoes.json
# Response
{"acknowledged":true}
5. Upload the Index template
The last step before you can index tornadoes is to upload the Index Template for the destination index. Because the template is prepared, the task is a single curl PUT against the
_template API endpoint.
# Index Template
$ curl -XPUT 'http://127.0.0.1:9200/_template/historical-tornadoes' \
  -H "Content-Type: application/json" -d @conf/template_tornadoes.json
# Response
{"acknowledged":true}
4. Index tornadoes documents - dataset
Finally, you can index (upload) the data from the CSV file into the Index in Elasticsearch. This index will be the data source for future visualizations and observation.
$ docker run -d \
  --name=filebeat \
  --user=root \
  --network="host" \
  --volume="$(pwd)/filebeat.docker.yml:/usr/share/filebeat/filebeat.yml:ro" \
  --volume="$(pwd)/data/1950-2019_actual_tornadoes.csv:/tmp/1950-2019_actual_tornadoes.csv" \
  docker.elastic.co/beats/filebeat:7.11.2 filebeat -e -strict.perms=false
Check the total count of the documents using the Kibana UI (Stack management -> Index Management) as you can see in the picture or using the curl call to Elasticsearch API endpoint.
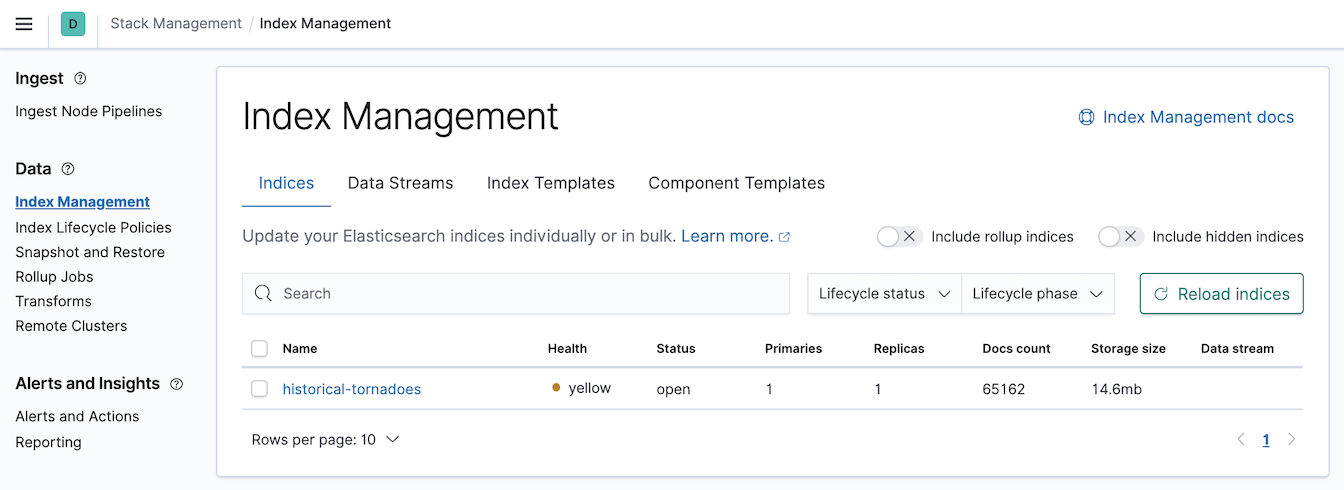
Two different options to check the total numbers of documents in an index.
curl -XGET 'http://127.0.0.1:9200/historical-tornadoes/_count?pretty'
{
  "count" : 65162,
  "_shards" : {
    "total" : 1,
    "successful" : 1,
    "skipped" : 0,
    "failed" : 0
  }
}
$ curl -XGET 'http://127.0.0.1:9200/_cat/count/historical-tornadoes?v'
epoch      timestamp count
1616796498 22:08:18  65162
If the total number of documents matches, you can stop Filebeat.
$ docker stop filebeat
$ docker rm filebeat
5. Import Saved objects
Saved objects are saved definitions of various components for Kibana application. It can be an index pattern, visualization, dashboard, map, etc. Once they are saved, you can
export them and import to another cluster. I prepared a few visualizations together with the Index pattern to start your journey quickly in this
GitHub file . You can find it in the repository in data/saved_objects.ndjson.
To import Saved objects, navigate to Kibana -> Stack Management -> Saved Objects, click Import and find the file data/saved_objects.ndjson in the GitHub repository data.
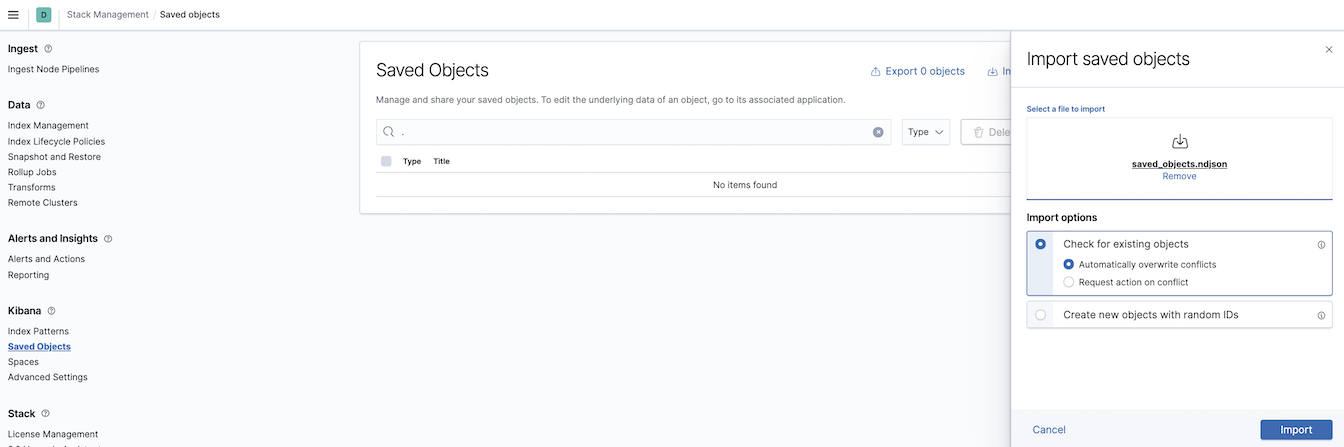
Import saved objects
6. Analyze Tornadoes
The data is indexed, and the visualizations are ready, let’s navigate to the Kibana -> Dashboards and open the [Historical Tornadoes] Overview. You will see the last 72 years’ worth of Tornadoes on the screen visualized in front of you.
Note that you cannot see all Tornadoes on the map as the map has a limit of 10000 documents at the same time. When you zoom in, filter, or change the time frame, the map will get more precise.
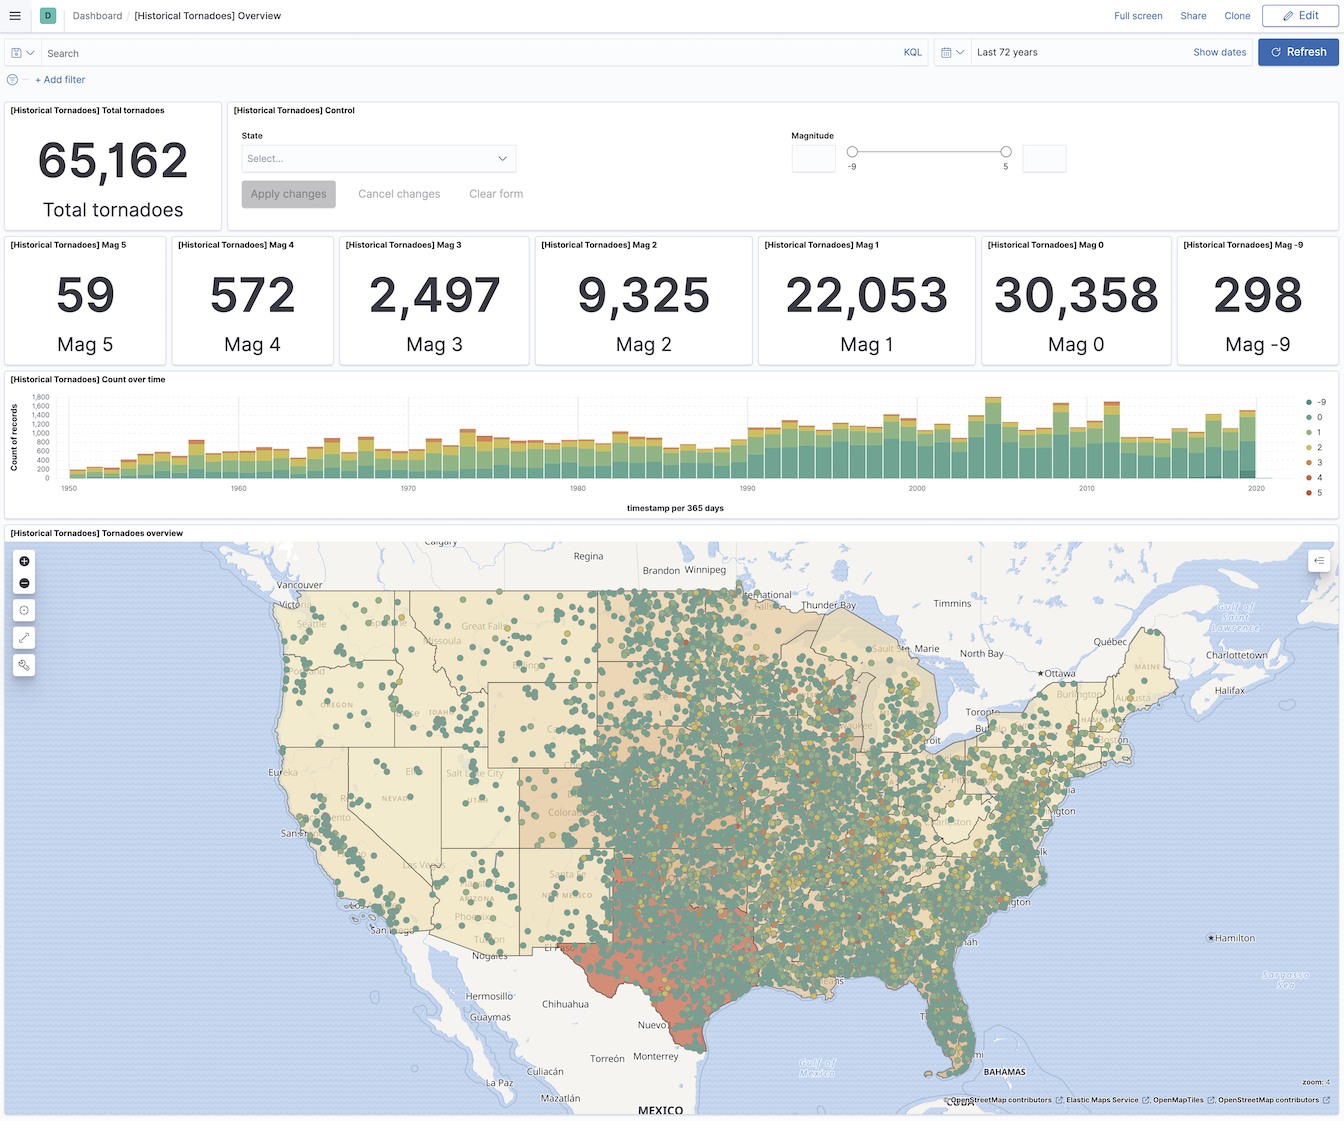
Tornadoes dashboard
Look around the dashboard and use Time filters, Search bar, or Filter options. In the following example are filtered Tornadoes with the strength 5.
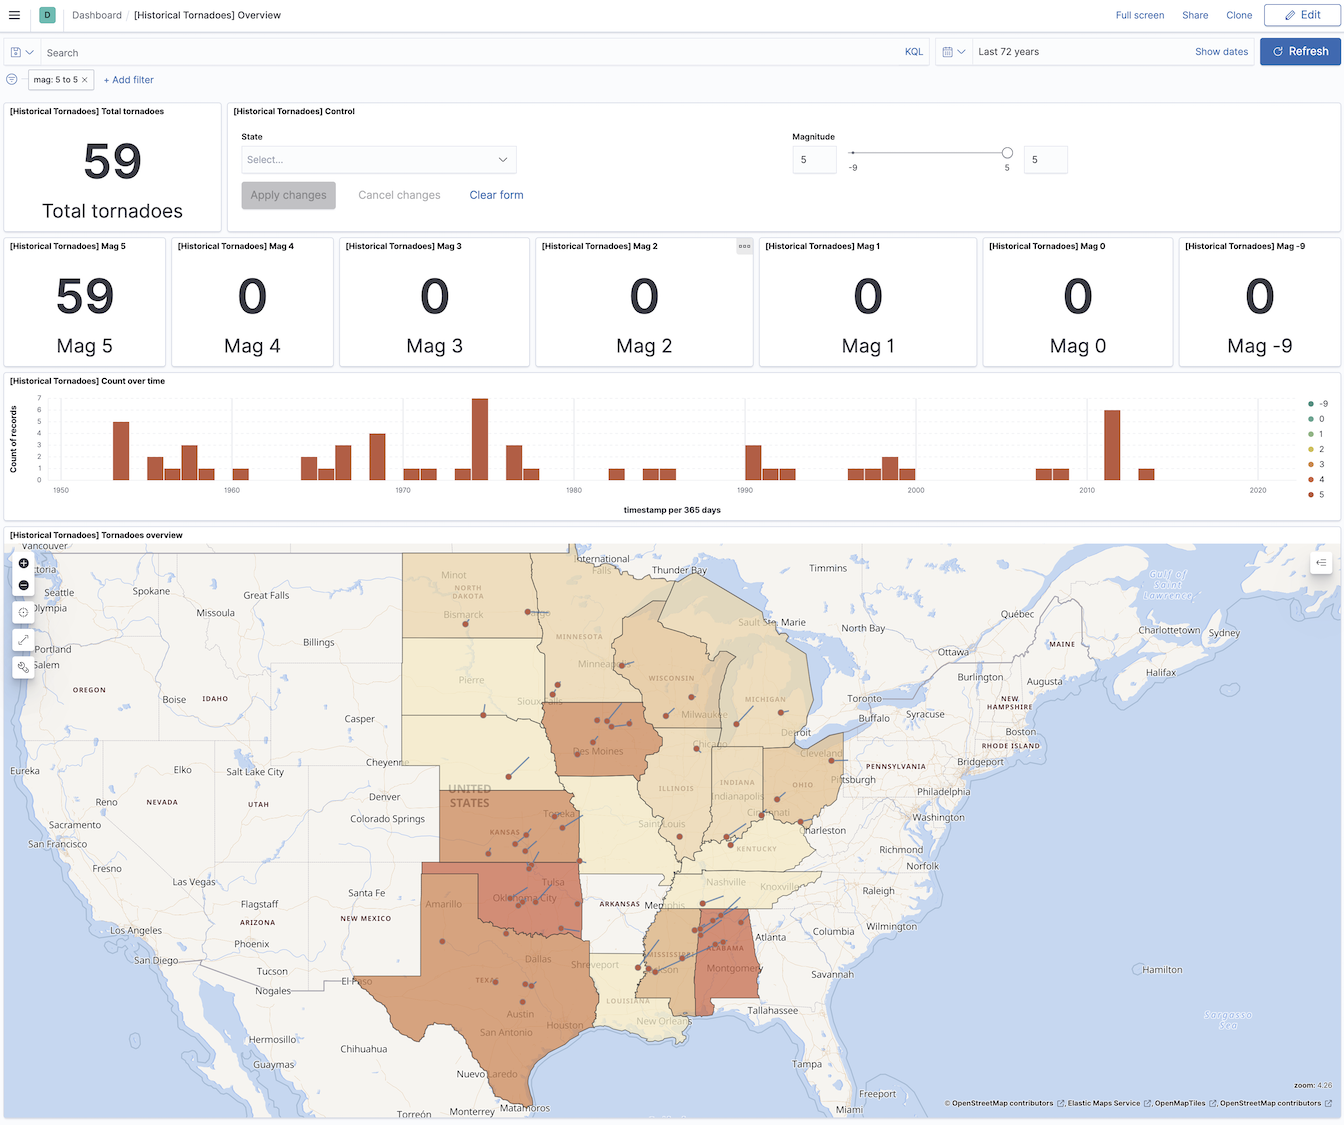
Tornadoes mag 5
I hope you enjoyed the post and succeeded with ingesting and playing with Tornados at home. If you have any feedback, leave me a comment down below and share the post with other people. If you created a fantastic visualization of the dashboards, feel free to let me know. Or, open a PR with your work and share it with the rest of the world.